> ## Documentation Index
> Fetch the complete documentation index at: https://docs.honeycomb.io/llms.txt
> Use this file to discover all available pages before exploring further.
# Extract Metric
Ent+
This feature is available as an add-on for the [Honeycomb Enterprise plan](https://www.honeycomb.io/pricing/).
Please contact your Honeycomb account team for details.
## Description
The Extract Metric Processor creates new metrics based on log telemetry. For logs matching a filter, the processor will extract a numerical value from a field and then create a metric with that value. The name, unit, and type of the created metric can be configured. Additionally, fields from matching logs can be preserved as metric attributes.
## Supported Types
| Metrics | Logs | Traces |
| :- | :- | :- |
| | ✓ | |
## Supported Collector Versions
`v1.14.0`+
## Configuration
The configuration of an Extract Metric processor consists of a number of sub-metrics that are defined using fields described below.
| Field | Description |
| :- | :- |
| Metric Name | The name of the metric that will be created. |
| Match | The log context the source field is located in. Options are `Body`, `Attributes`, and `Resource`. |
| Metric Field | The name of the source field containing a numeric value that will become the new metric value. |
| Metric Type | The type of metric that will be created. Options are `gauge_double`, `gauge_int`, `counter_double`, and `counter_int`. |
| Metric Unit | The unit of the created metric. Some default choices provided with the ability to create a custom unit. |
| Attributes | Existing attributes on the source log that should be carried over. Can also specify new metric attributes. Each value is an OTTL [path](https://github.com/open-telemetry/opentelemetry-collector-contrib/blob/main/pkg/ottl/LANGUAGE.md#paths) expression that extracts data from the log. |
## Example Configuration
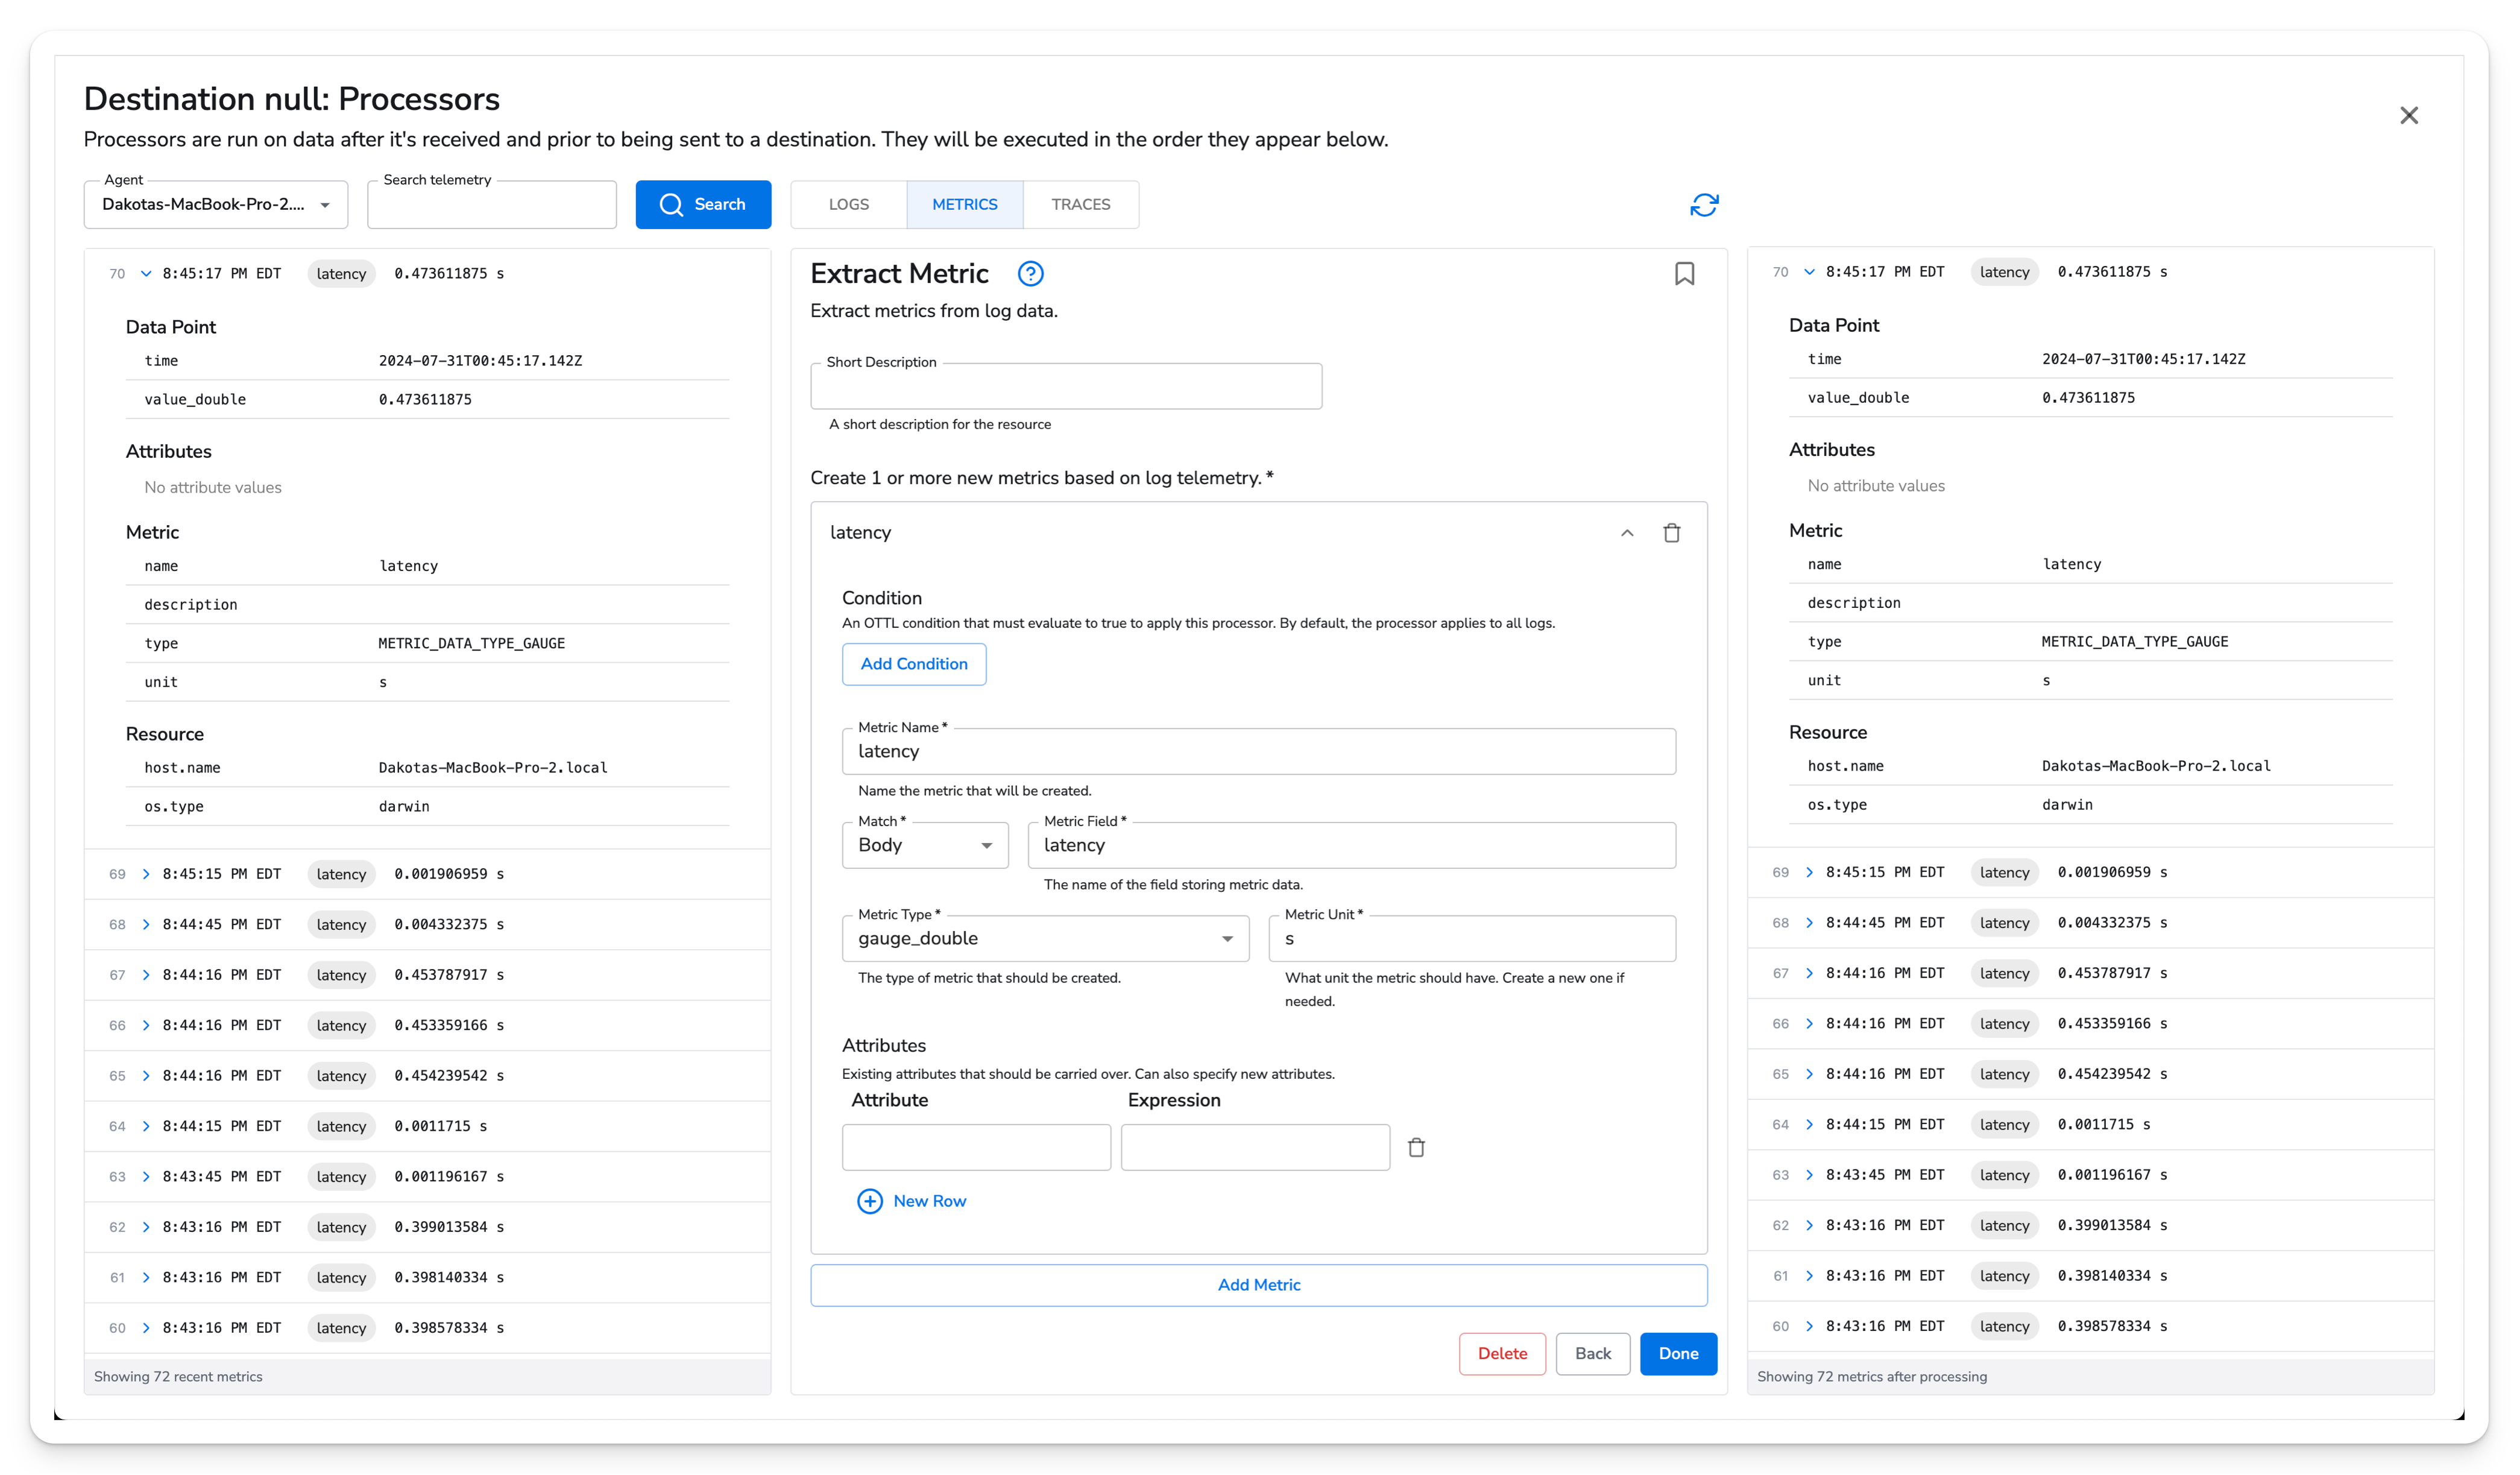
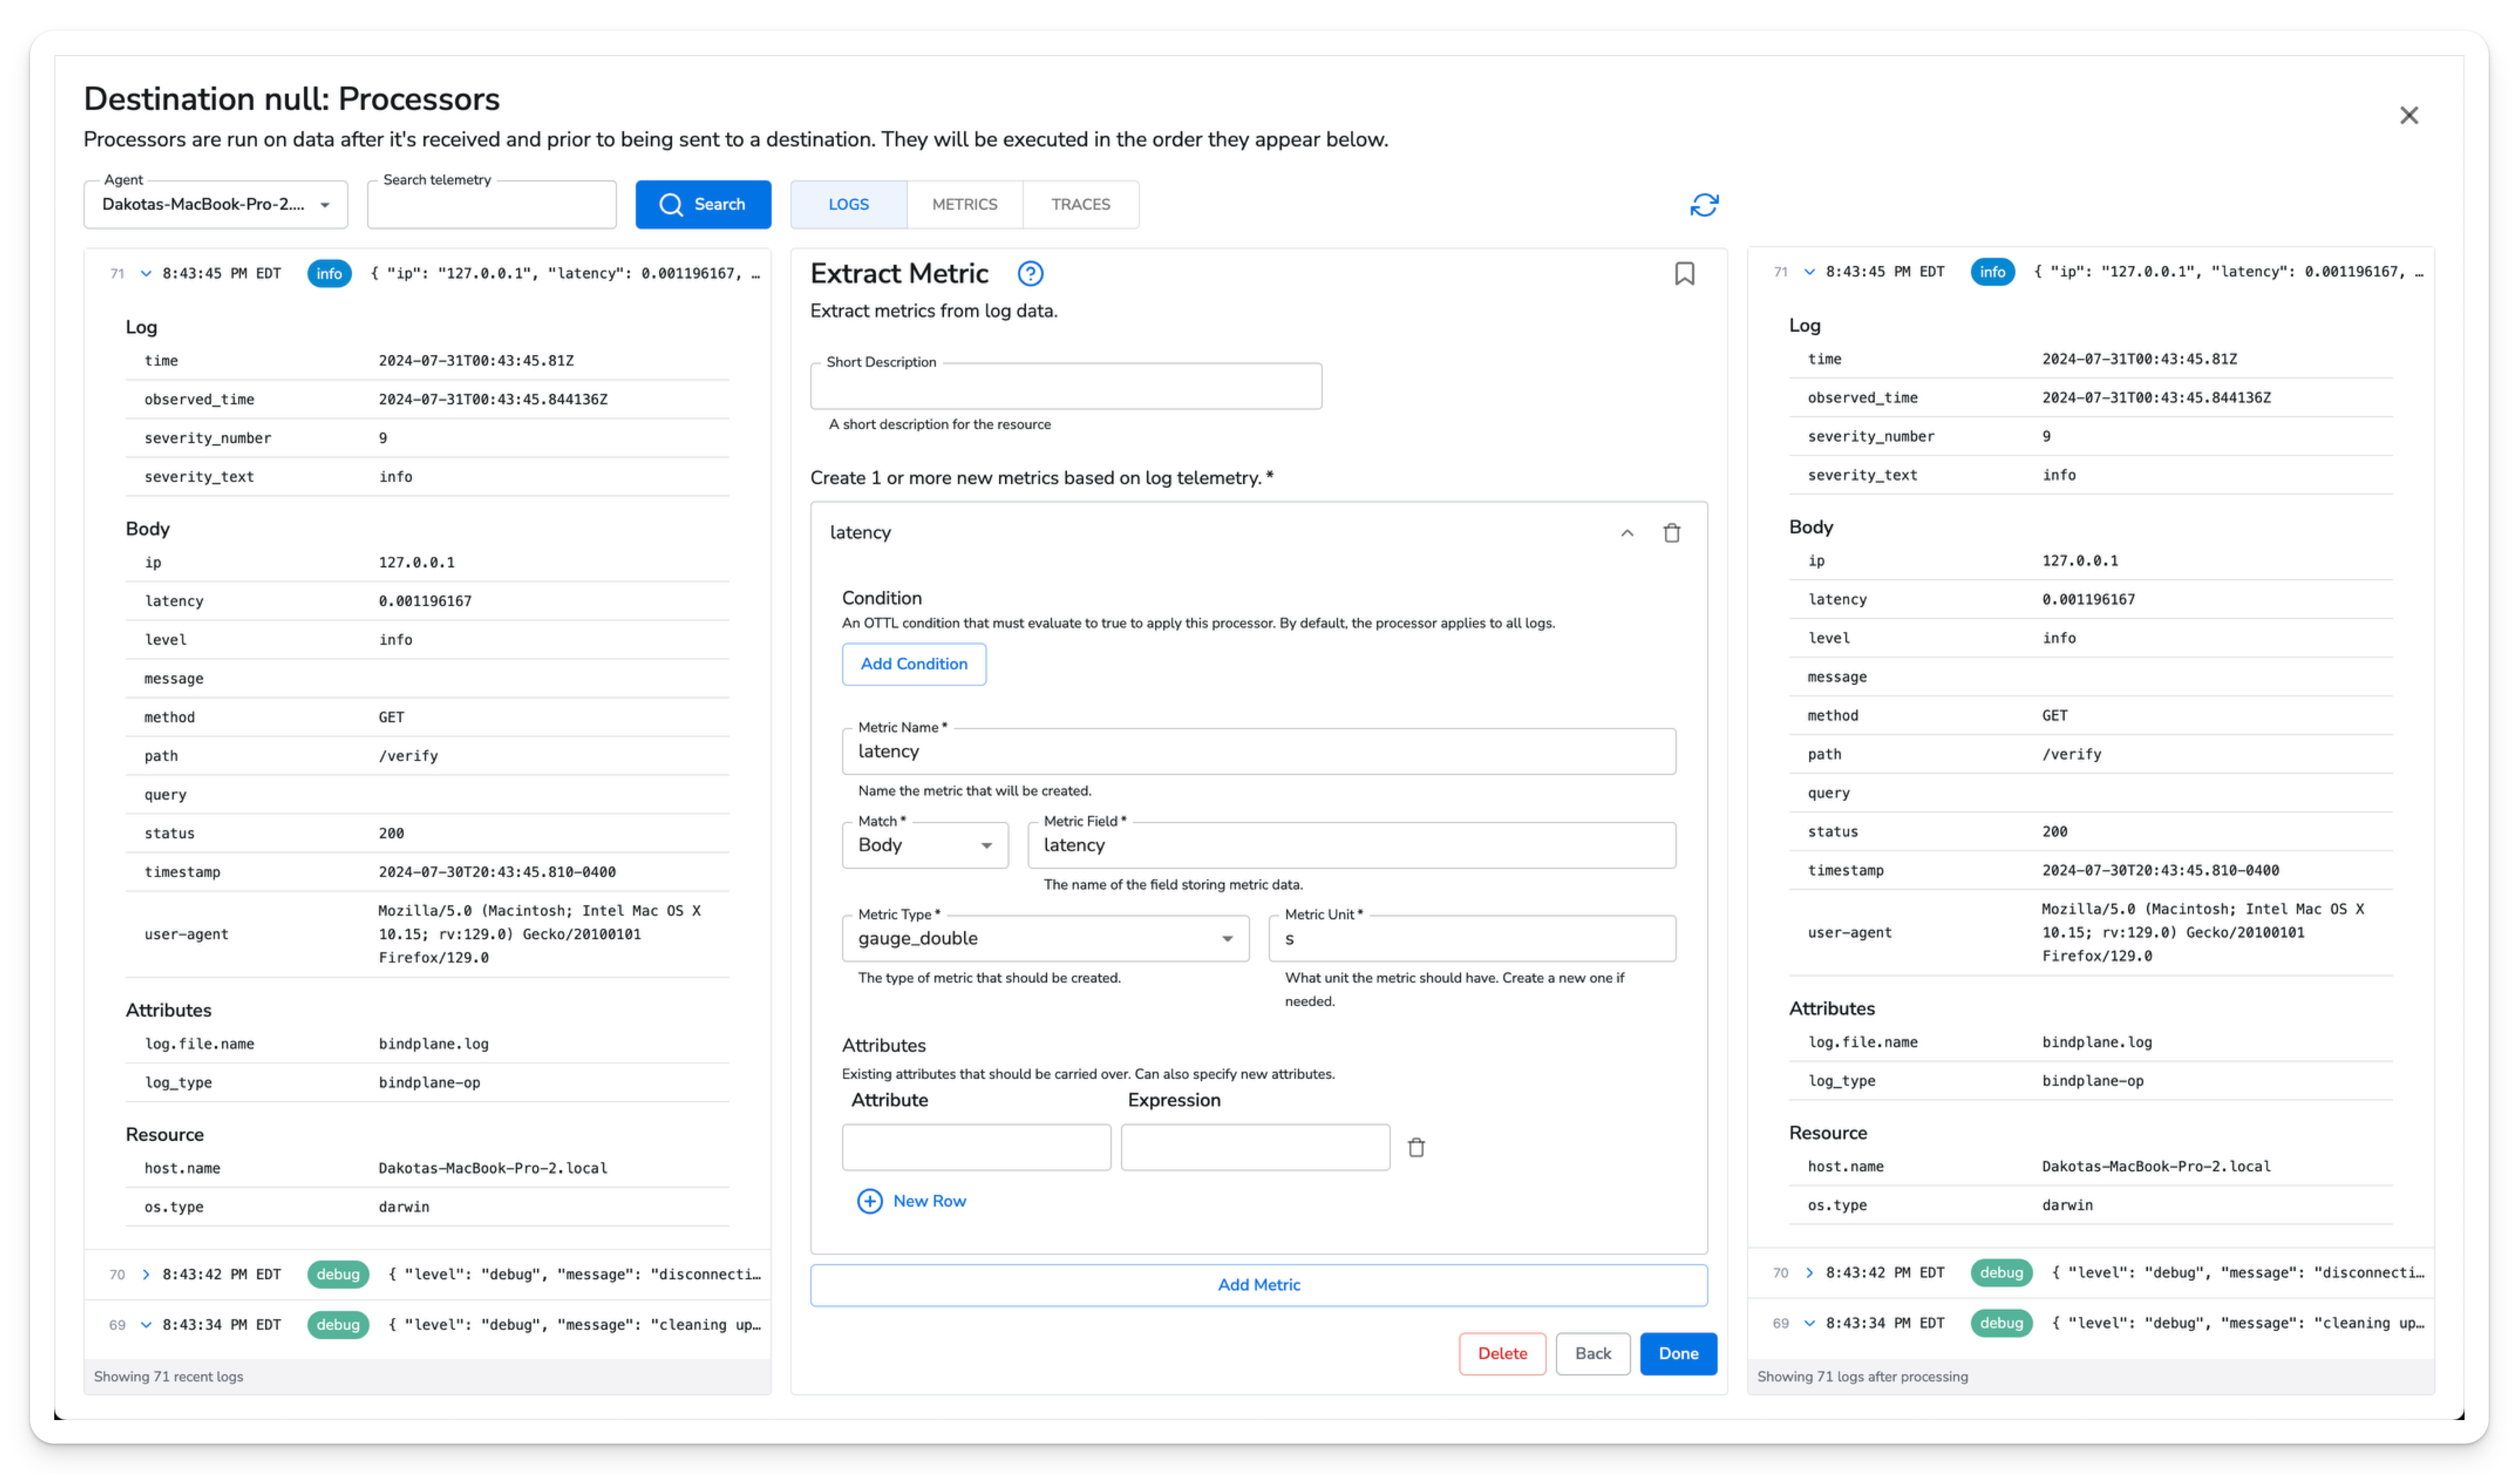
In this configuration we are creating a new latency metric based on a field in the log body.
Here is the new `latency` metric created as a `gauge_double` with seconds set as the unit.
 Now we can see the new metric in the snapshot view.