> ## Documentation Index
> Fetch the complete documentation index at: https://docs.honeycomb.io/llms.txt
> Use this file to discover all available pages before exploring further.
# Agent Timeline
> Monitor conversations, LLM calls, tool invocations, errors, and token usage in your agent workflows
export const HnyIcon = ({alias, path, size = 16, iconColor}) => {
const iconMap = {
"home": "house.svg",
"marker": "caretFilledDown.svg",
"show-marker-options": "chatTextLeft.svg",
"download": "arrowLineDown.svg",
"trace-waterfall": "trace.svg",
"show-query-details": "listDashes.svg",
"table": "table.svg",
"log-lines": "logLines.svg",
"chart": "chartLine.svg",
"show-settings": "gear.svg",
"add": "plus.svg",
"remove": "delete.svg",
"persist": "caretDown.svg",
"close": "close.svg",
"copy": "copy.svg",
"zoom-in": "magnifyingGlassPlus.svg",
"zoom-out": "magnifyingGlassMinus.svg",
"color-assignment": "drop.svg",
"drag": "dots-six-vertical.svg",
"drawer": "drawer.svg",
"show-actions": "dotsThree.svg",
"edit": "pencil.svg",
"delete": "trash.svg",
"move": "arrowsOutCardinal.svg",
"show-legend": "circleInfo.svg",
"usage-ok": "usageGood.svg",
"usage-warning": "usageWarning.svg",
"usage-danger": "usageDanger.svg",
"open-query-builder": "query.svg",
"home-menu": "house.svg",
"query-menu": "query.svg",
"boards-menu": "board.svg",
"triggers-menu": "bell.svg",
"slos-menu": "handshake.svg",
"service-map-menu": "serviceMap.svg",
"history-menu": "clockCounterClockwise.svg",
"manage-data-menu": "cube.svg",
"usage-menu": "usageGood.svg",
"canvas-menu": "sparkle.svg",
"anomalies-menu": "anomalies.svg",
"show-details": "dotsThreeVertical.svg",
"resize-handle": "board-panel-resize-handle.png",
"standard-dataset": "cube.svg",
"trace-dataset": "cubeChat.svg",
"all-datasets": "linkedSquares.svg",
"share": "arrowBentRight.svg",
"run-in-query-builder": "arrowSquareUpRight.svg",
"link": "link.svg",
"text": "text.svg",
"receive": "arrowLineDown.svg",
"process": "lightning.svg",
"sample": "drop.svg",
"send": "arrowLineUp.svg",
"submit": "arrowUp.svg",
"canvas-menu": "sparkle.svg",
"canvas": "sparkle.svg",
"chat-about-this-page": "sparkle.svg",
"private": "lockKey.svg",
"shared": "people.svg",
"expand": "caretDown.svg",
"previous": "caretLeft.svg",
"next": "caretRight.svg",
"expand-chat": "caretLeft.svg",
"minimize-chat": "caretRight.svg",
"open-in-canvas": "arrowSquareUpRight.svg",
"send-test": "EnvelopeSimple.svg",
"ai-ecosystem": "robot.svg"
};
const iconBasePath = "/_assets/icons/";
const iconPath = path || (alias ? `${iconBasePath}${iconMap[alias]}` : undefined);
return ;
};
Agent Timeline is available on Free, Pro, and Enterprise Honeycomb plans.
Honeycomb's Agent Timeline gives you a unified view of LLM behavior and multi-agent workflows.
Use it to investigate entire conversations (multi-trace sessions over time) and quickly see where prompts, tool calls, and failures happened, in the order they happened.
To use the Agent Timeline:
1. Select **AI Ecosystem** () from the navigation menu.
2. Select the **Conversations** tab.
3. Enter a conversation ID, or browse the list of recent conversations.
You can also select a `gen_ai.conversation.id` from a Query Results view to open that conversation in the Agent Timeline.
To see your conversations or multi-agent sessions in the Agent Timeline, make sure your [instrumentation emits spans with GenAI attributes](/send-data/use-cases/agents/).
 ## Conversations view
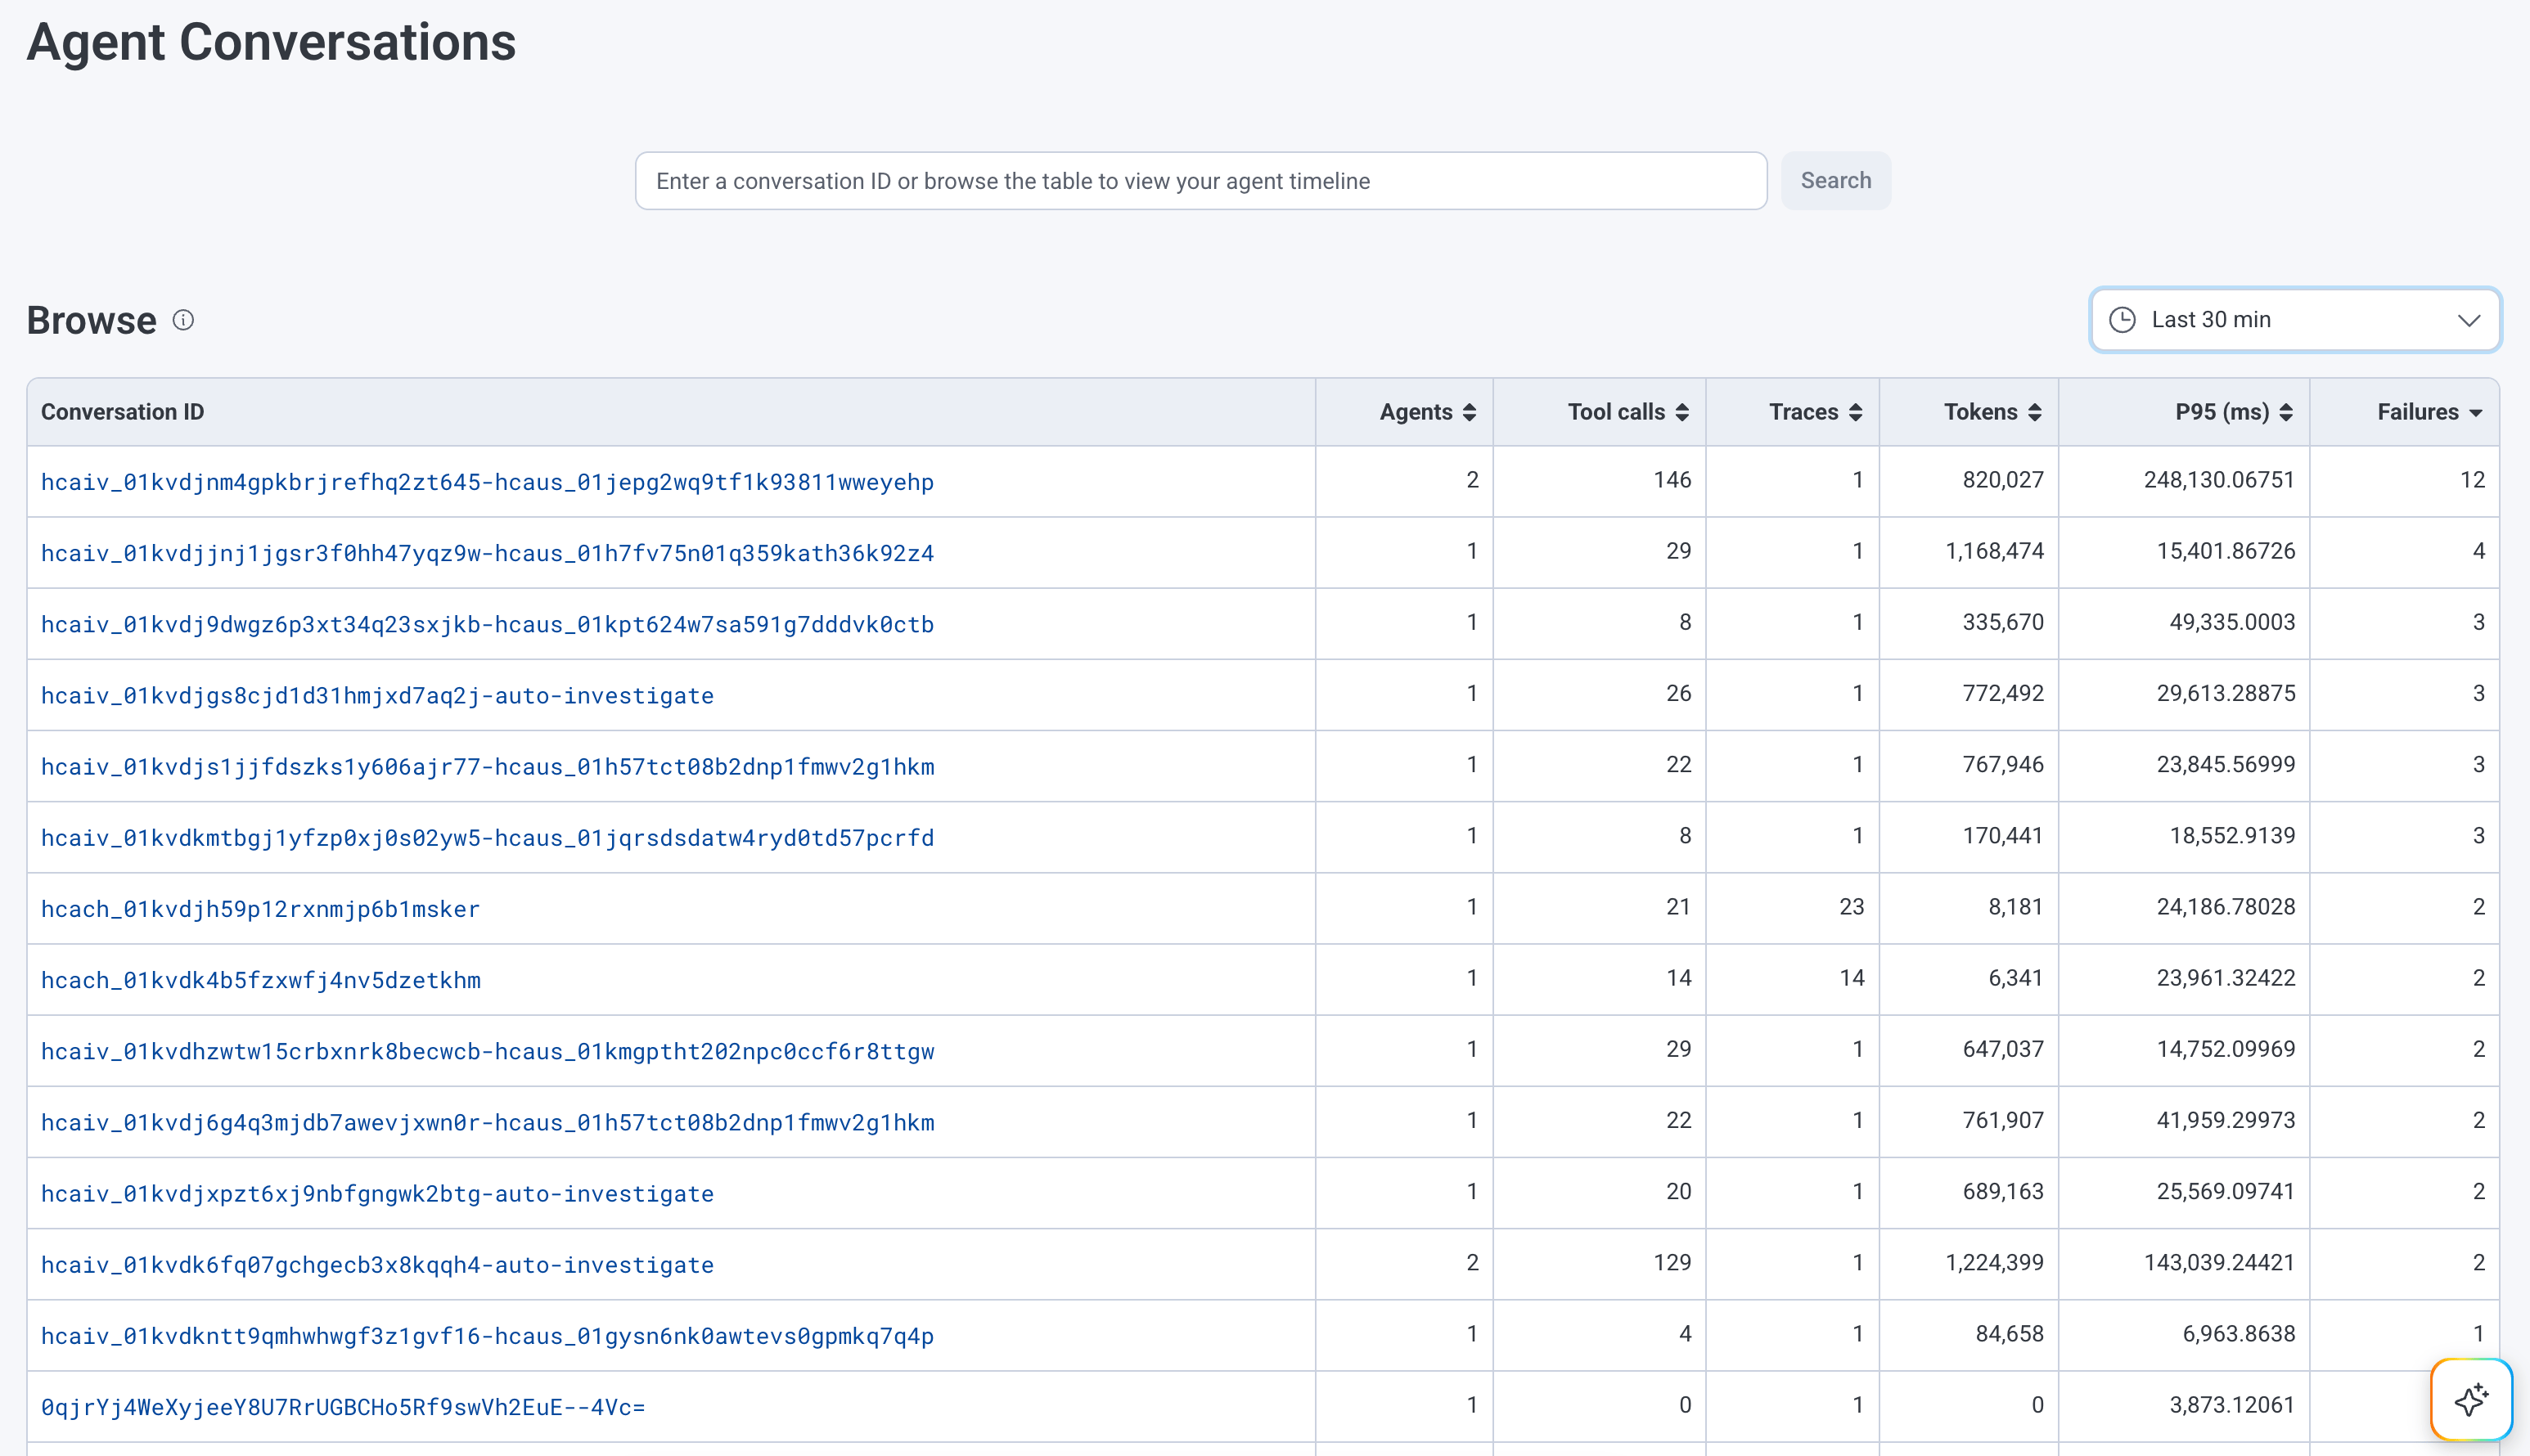
Browse from a list of agent conversations in the last 60 days.
Each entry in the list includes agent counts, tool calls, number of tokens, P95 latency, and failure counts.
## Conversations view
Browse from a list of agent conversations in the last 60 days.
Each entry in the list includes agent counts, tool calls, number of tokens, P95 latency, and failure counts.
 ## Agent Timeline view
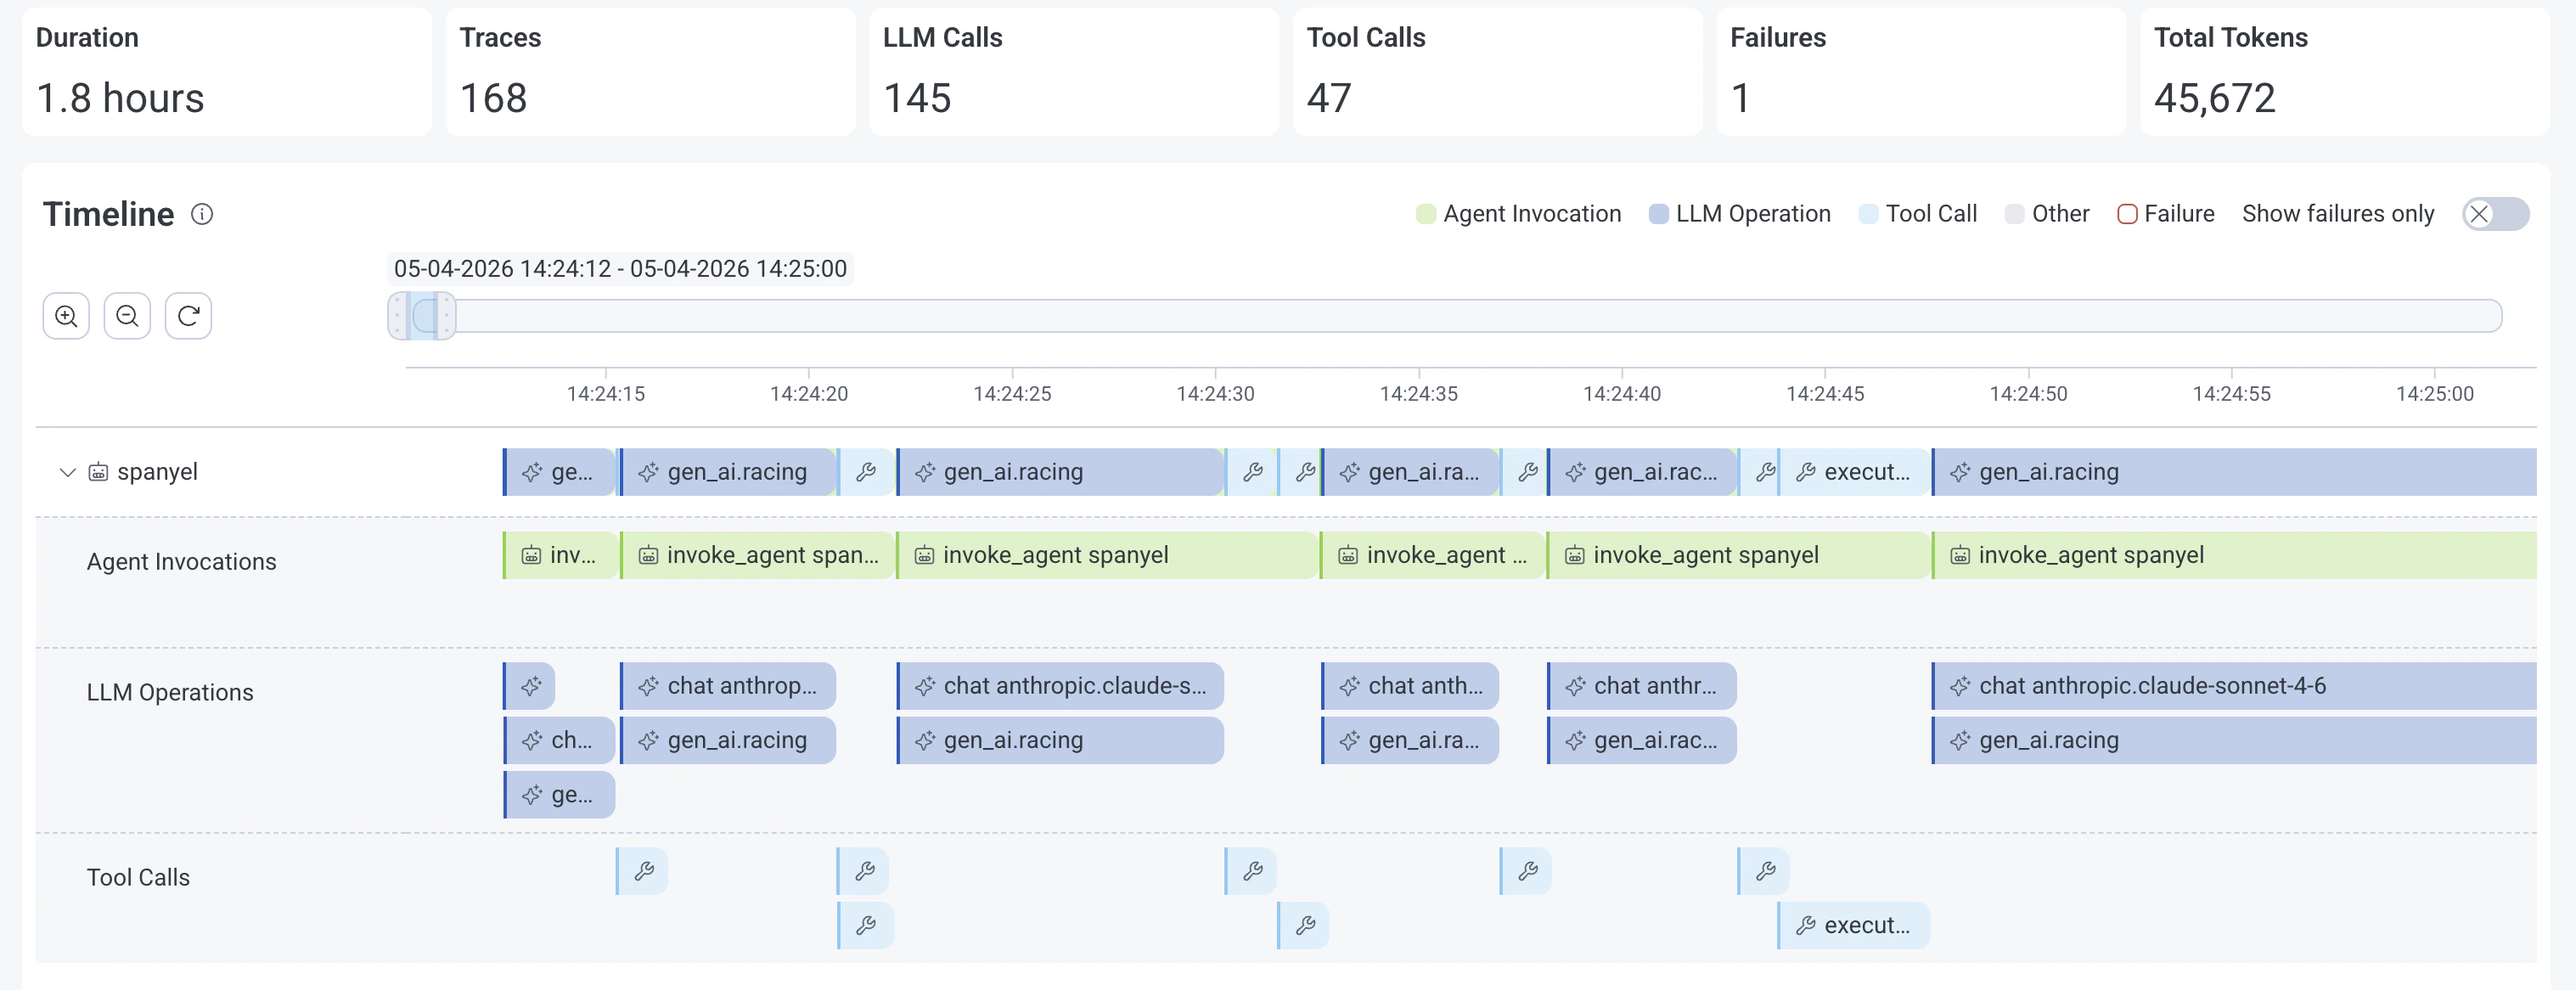
The conversation view of the Agent Timeline displays some key metrics at the top, a timeline of GenAI spans, a GenAI span details view on the side, and a traces view to inspect related spans and errors.
Conversation metrics:
* **Duration**: How long the conversation or session lasted.
* **Traces**: Count of traces.
* **LLM Calls**: Number of GenAI spans where the `gen_ai.operation.name` attribute is equal to `"chat"`, `"generate_content"`, or `"text_completion"`.
* **Tool Calls**: Count of GenAI spans where the `gen_ai.operation.name` attribute is equal to `"execute_tool"`.
* **Failures**: Error/exception count.
* **Total Tokens**: How many tokens were used, both input and output, in the conversation.
### Timeline Insights
Early Access (EA)
Timeline Insights is available in Early Access and requires Honeycomb Intelligence to be enabled on your team.
When a conversation loads, the Agent Timeline automatically surfaces an insight panel as an expandable accordion at the top of the page.
Insights cover failures, retry loops, latency, and token cost, so you don't have to read through the full conversation to find what went wrong.
## Agent Timeline view
The conversation view of the Agent Timeline displays some key metrics at the top, a timeline of GenAI spans, a GenAI span details view on the side, and a traces view to inspect related spans and errors.
Conversation metrics:
* **Duration**: How long the conversation or session lasted.
* **Traces**: Count of traces.
* **LLM Calls**: Number of GenAI spans where the `gen_ai.operation.name` attribute is equal to `"chat"`, `"generate_content"`, or `"text_completion"`.
* **Tool Calls**: Count of GenAI spans where the `gen_ai.operation.name` attribute is equal to `"execute_tool"`.
* **Failures**: Error/exception count.
* **Total Tokens**: How many tokens were used, both input and output, in the conversation.
### Timeline Insights
Early Access (EA)
Timeline Insights is available in Early Access and requires Honeycomb Intelligence to be enabled on your team.
When a conversation loads, the Agent Timeline automatically surfaces an insight panel as an expandable accordion at the top of the page.
Insights cover failures, retry loops, latency, and token cost, so you don't have to read through the full conversation to find what went wrong.
 ### Conversation timeline
The conversation timeline displays GenAI spans grouped by agent name (`gen_ai.agent.name`), with nested GenAI spans grouped by GenAI operation type: **Agent Invocations**, **LLM Operations**, and **Tool Calls**.
**Controls**
* Move the slider to view different periods on the timeline.
* Zoom in/out (/) or resize the slider to adjust the viewable time period.
* Toggle **Show Failures Only** to only show spans with errors on the timeline.
* Expand or collapse () an agent span group.
You can view spans nested under GenAI spans and related errors using the **Traces** view below the **Timeline**.
Selecting a GenAI span on the timeline opens a detailed view with three tabs: **Gen AI**, **Fields**, and **Links**.
In the **Fields** tab you can filter span fields by name or value, and if there are any links on the span, you can see them in the **Links** tab.
### Gen AI tab
In the **Gen AI** tab, you will find details about the selected GenAI span.
**Identity**
* **Operation**: The `gen_ai.operation.name` (`chat`, `invoke_agent`, `execute_tool`)
* **Conversation ID**: Unique conversation identifier
* **Agent**: Name of the agent
The rest of the fields you see depend on the type of GenAI span you select.
#### Agent invocations
The **Gen AI** tab displays conversation content (if available) for agent invocation spans.
In the **Messages** section, you will see content of the conversation if available. This includes system and user prompts along with responses from LLMs and tools.
#### LLM operations
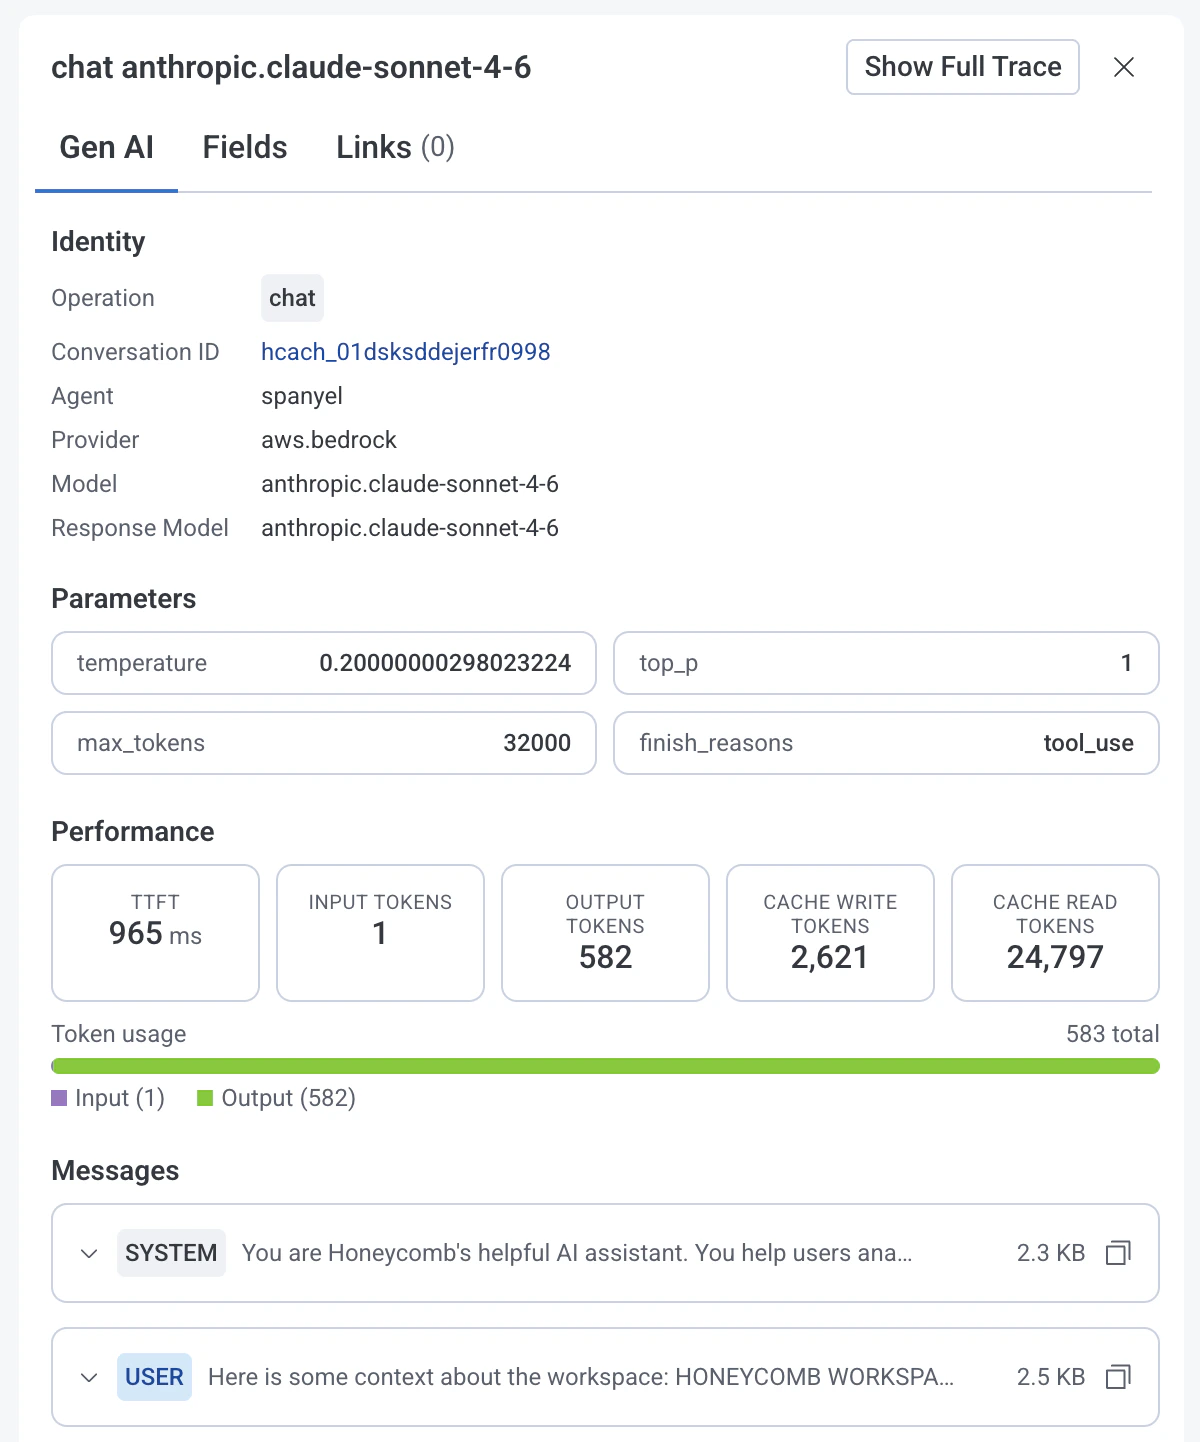
The **Gen AI** tab displays the following fields for LLM operation spans.
* **Provider**: Name of the LLM provider
* **Model**: Requested LLM model
* **Response Model**: LLM model that generated the response
**Parameters**
* **Temperature**: Requested temperature setting.
* **Max Tokens**: Requested maximum number of tokens the model should generate.
* **Top P**: `top_p` sampling setting for the LLM request.
* **Finish Reasons**: Reasons why the LLM model stopped generating tokens.
**Performance**
* **Time To First Token (TTFT)**: Time elapsed between sending a request to the LLM model and receiving the first token of its response.
* **Input Tokens**: Number of input tokens used.
* **Output Tokens**: Number of output tokens used.
* **Cache Write Tokens**: Count of tokens written to cache.
* **Cache Read Tokens**: Count of tokens read from cache.
* **Token Usage**: Total amount of tokens used by the operation.
In the **Messages** section, you will see content of the conversation if available. This includes system and user prompts along with responses from LLMs and tools.
### Conversation timeline
The conversation timeline displays GenAI spans grouped by agent name (`gen_ai.agent.name`), with nested GenAI spans grouped by GenAI operation type: **Agent Invocations**, **LLM Operations**, and **Tool Calls**.
**Controls**
* Move the slider to view different periods on the timeline.
* Zoom in/out (/) or resize the slider to adjust the viewable time period.
* Toggle **Show Failures Only** to only show spans with errors on the timeline.
* Expand or collapse () an agent span group.
You can view spans nested under GenAI spans and related errors using the **Traces** view below the **Timeline**.
Selecting a GenAI span on the timeline opens a detailed view with three tabs: **Gen AI**, **Fields**, and **Links**.
In the **Fields** tab you can filter span fields by name or value, and if there are any links on the span, you can see them in the **Links** tab.
### Gen AI tab
In the **Gen AI** tab, you will find details about the selected GenAI span.
**Identity**
* **Operation**: The `gen_ai.operation.name` (`chat`, `invoke_agent`, `execute_tool`)
* **Conversation ID**: Unique conversation identifier
* **Agent**: Name of the agent
The rest of the fields you see depend on the type of GenAI span you select.
#### Agent invocations
The **Gen AI** tab displays conversation content (if available) for agent invocation spans.
In the **Messages** section, you will see content of the conversation if available. This includes system and user prompts along with responses from LLMs and tools.
#### LLM operations
The **Gen AI** tab displays the following fields for LLM operation spans.
* **Provider**: Name of the LLM provider
* **Model**: Requested LLM model
* **Response Model**: LLM model that generated the response
**Parameters**
* **Temperature**: Requested temperature setting.
* **Max Tokens**: Requested maximum number of tokens the model should generate.
* **Top P**: `top_p` sampling setting for the LLM request.
* **Finish Reasons**: Reasons why the LLM model stopped generating tokens.
**Performance**
* **Time To First Token (TTFT)**: Time elapsed between sending a request to the LLM model and receiving the first token of its response.
* **Input Tokens**: Number of input tokens used.
* **Output Tokens**: Number of output tokens used.
* **Cache Write Tokens**: Count of tokens written to cache.
* **Cache Read Tokens**: Count of tokens read from cache.
* **Token Usage**: Total amount of tokens used by the operation.
In the **Messages** section, you will see content of the conversation if available. This includes system and user prompts along with responses from LLMs and tools.
 #### Tool calls
The **Gen AI** tab displays these fields for tool call spans:
* **Tool Name**: Name of the tool or function.
* **Type**: Type of tool used by the agent (`function`, `extension`, `datastore`).
* **Call ID**: Unique tool call identifier.
Any arguments passed to the tool call are displayed (in JSON format), followed by the result (if any).
#### Tool calls
The **Gen AI** tab displays these fields for tool call spans:
* **Tool Name**: Name of the tool or function.
* **Type**: Type of tool used by the agent (`function`, `extension`, `datastore`).
* **Call ID**: Unique tool call identifier.
Any arguments passed to the tool call are displayed (in JSON format), followed by the result (if any).